Track Non-Financial Metrics that Actually Drive Growth
Since the shift to a hybrid workforce, CFOs were forced to rewrite capital allocation and growth plans overnight. Data-driven CFOs became the critical executive supporting the CEO in critical decision-making and organisational agility.Since the shift to a hybrid workforce, CFOs were forced to rewrite capital allocation and growth plans overnight. Data-driven CFOs became the critical executive supporting the CEO in critical decision-making and organisational agility.
To lead a resilient financial operation, progressive CFOs took calculated risks to recover revenues from the events of pandemic disruption. They partnered with executive peers as a role model for efficiency, sustainability, trust and managed risk.
Executives looked to CFOs to measure value and performance to progress towards a culture of innovation.
At ADAPT’s CFO Edge, gathering 120 of Australia’s top CFOs, financial leaders from Standard Bank Group, Deloitte, and IBM share their non-financial indicators of organisational growth.
Standard Bank’s Group CFO, Arno Daehnke, reveals the six ‘True North’ metrics he tracks to drive sustainable growth and value.
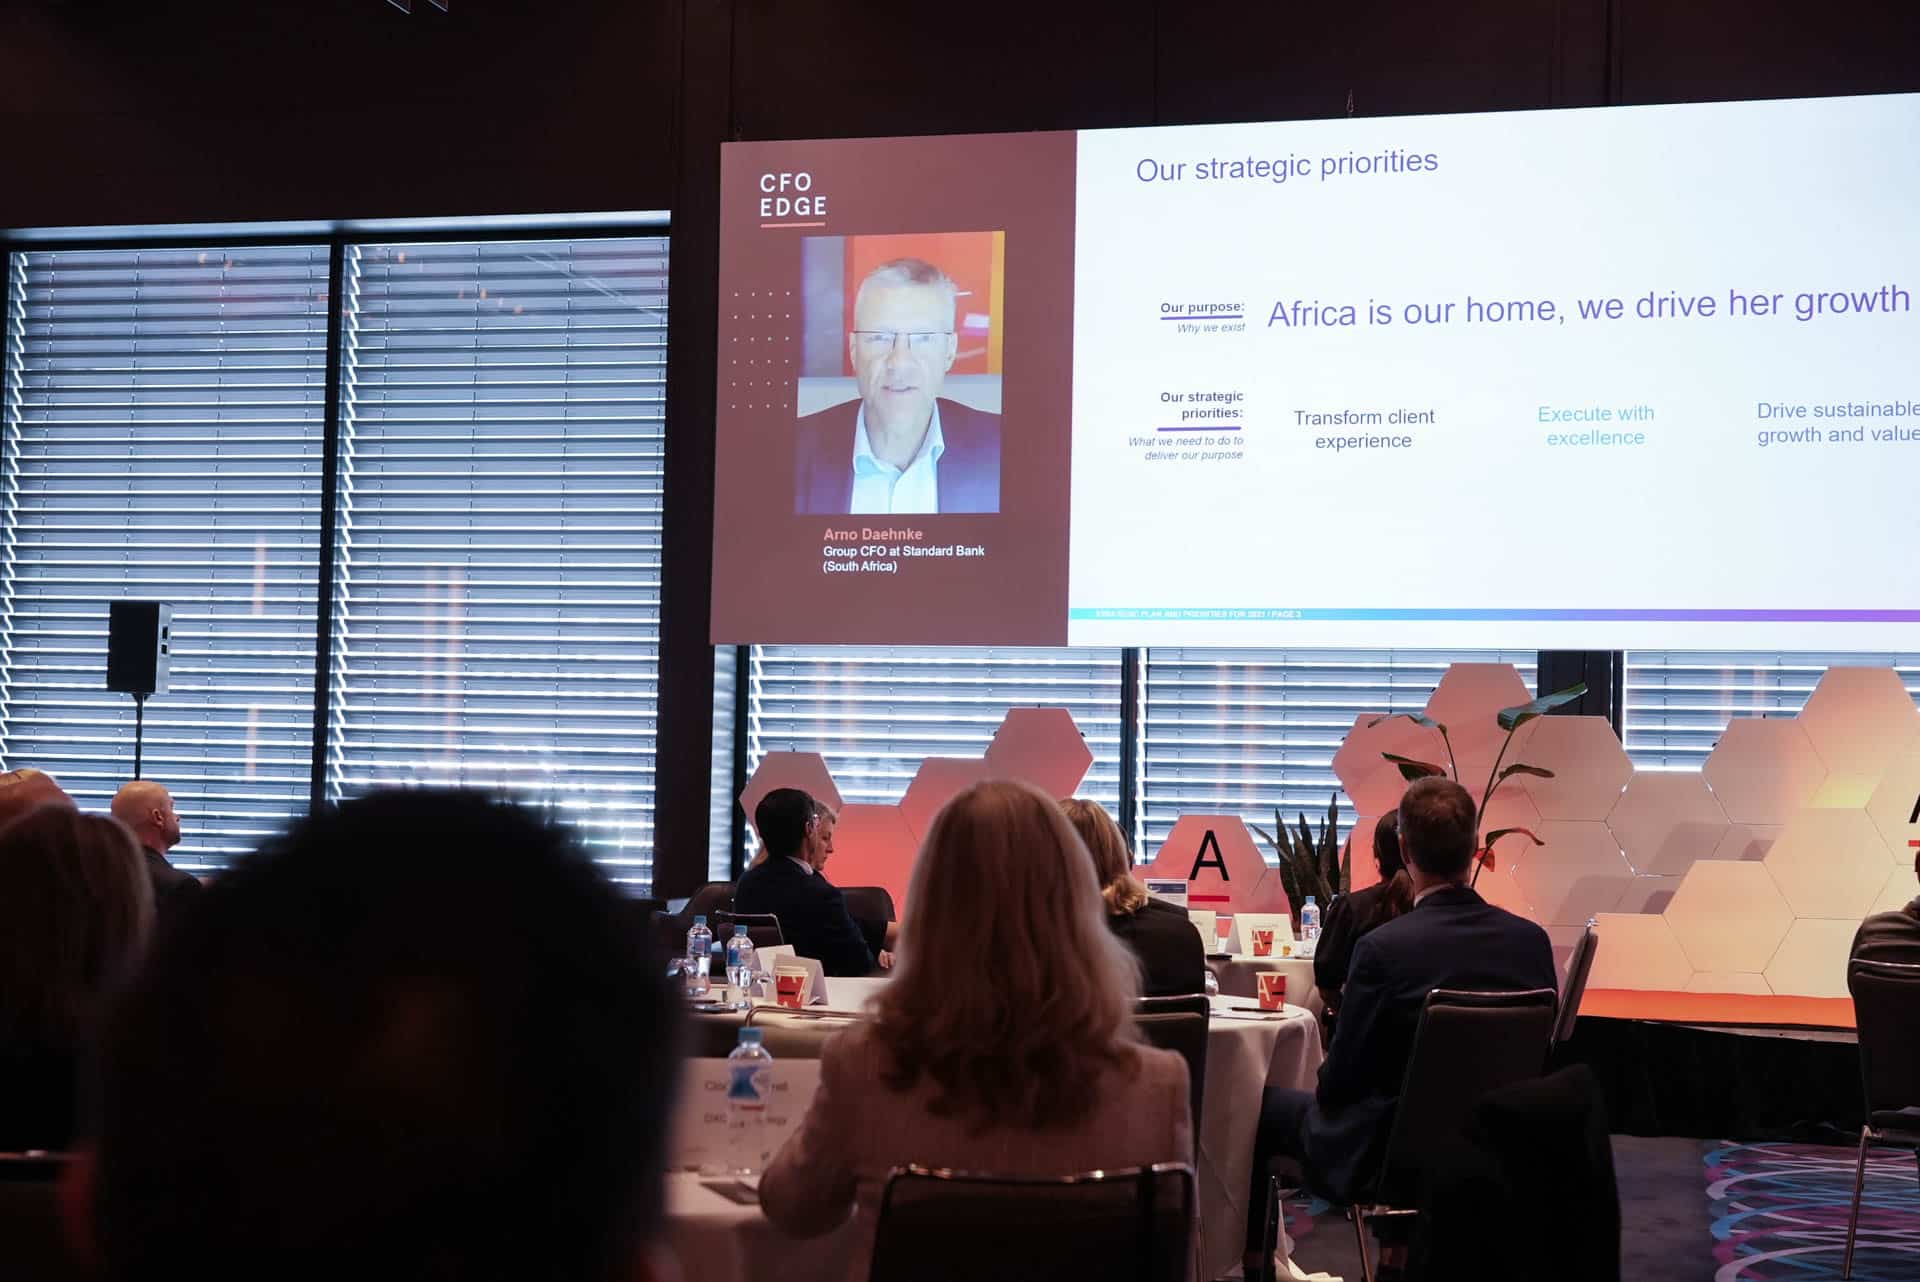
I will give you a quick sense of the kind of things we measure across the value drivers. We have a set of around 20 metrics that we measure internally and report to our board. We are in the process of defining which metrics we will use externally to help guide the market.
For example, we measure usual client satisfaction scores like net promoter scores on a client, and I’m sure you’ll also be doing that. But we also measure the number of digitally active clients, the solutions, the number of solutions per client, the number of transactions executed 100% digitally on a straight three process basis.
You can also see that we measure things like employee net promoter scores, regrettable turnover, learning hours per employee, and women in leadership.
Uncover more about how Arno drove their transformation journey with improved forecasting and agility in this presentation highlight.
Only ADAPT Research and Advisory clients can access Arno’s full CFO Edge presentation.
Deloitte Australia’s CFO, Jody Burton, shares the core metrics she communicates to the board to drive forward their growth, transformation, and brand delivery excellence.
Beneath that, businesses will have various inputs utilisation, et cetera the traditional ones to drive that, but then we have metrics around transformation. So now that is really where it’s interesting. It’s what proportion of our services are being delivered that were not two years ago.
For example, what’s the portfolio mix looking like around the nature of that revenue, and how transformative are we in delivering new products and services and measuring how we’re disrupting ourselves?
Because despite the success, we’ve had double-digit growth for the last five years. That’s probably the ideal time to be disrupting yourself. We measure our disruption through the transformation piece and then obviously deliver excellence is important.
Service excellence is core to our brand and being able to then circle back through the growth. The amount of digital and data transformation that we have at the centre enables the level of growth that you have.
Then once you have that growth, you can continue to self-invest and invest back into the transformation. So, you need to have that cycle going. That’s the heart of what we’re doing.
Learn the metrics each organisation can measure to align their contribution to the overall business strategy in Jody’s full interview.
Global Financial Transformation Leader, Scott Layton, says that employee happiness, job satisfaction, and time spent on strategic work are their most important success metrics.
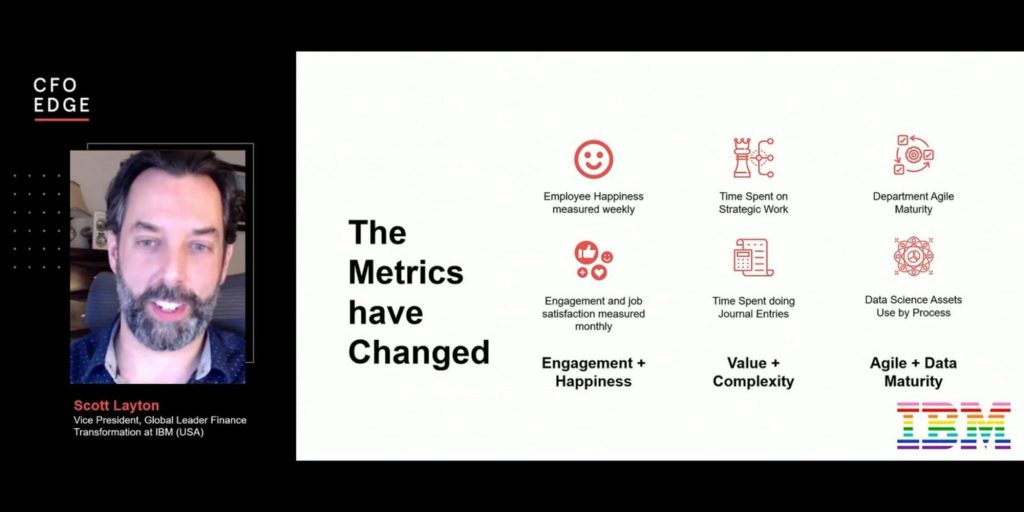
The metrics have changed. These are real metrics; these are metrics that we look at on our scorecard every quarter for IBM. We measure employee happiness. We measure it weekly. We have massive data polls on this.
Let me tell you. It’s incredible when you start having employees weekly telling you how happy they are. You see, we all know the mood goes down during quarter close. We get it.
But it is more than that because we see mood consistently improving as you’re creating more valuable work for people.
They’re now more engaged with their job, and you measure that through happiness, through employee engagement that we’re doing monthly.
You can see when a transformation initiative happens. You can see that the employees like it. They appreciate it. They don’t have to do that menial job that they hated doing.
We can see them stop doing that. They no longer have to do that meeting that they didn’t think added value.
They see the results of them being part of that change. We see them having ownership and responsibility and becoming part of that change and becoming their own advocates.
We see this now, and they see the direct results of their advocacy for change in the company. You see, it measured.
We also measure things like time spent on strategic work. I’ll give you a real number here in 2020 at IBM. We ended the year with 14% of our finance organisation’s time spent on strategic work.
Now, that doesn’t seem like a lot. You might say that should be like 30 or 40%. I challenge you to do better, but it’d be great if you did.
The best part is that we know that number now, which doubled during the year. It started the year off at about 7-8%
By the end of the year, we had doubled the amount of time our people spent on strategic work.
Scott explores more of his lessons learnt as he implemented agile practices and drove interdepartmental collaboration in his presentation highlight.
ADAPT Research, and Advisory clients can watch IBM’s financial leader’s full presentation on fostering happy, productive and agile employees.


